

Indonesia’s Economic Growth and Power-Sector Emissions: Development Outpacing Decarbonization
Thompson Rivers University
Indonesia is ranked fourth among the world's most populous countries (Statista, 2025) and among the world’s top ten emitters (International Energy Agency, n.d.). As both its economy and population continue to expand, it is critical, as explained by the IPAT framework (Ehrlich & Holdren, 1971), that the country reduce its carbon intensity to achieve its climate targets.
Decarbonizing the power sector presents a critical opportunity to support sustained economic growth while also reducing emissions. Energy sector emissions are closely tied to economic growth (GDP) in Indonesia, primarily due to the presence of manufacturing and other heavy industries. With electricity demand projected to increase fivefold from 2020 levels by 2050 (Diyono, et al., 2023), it is imperative to align economic development with climate commitments. This commentary uses the IPAT framework to analyze how Indonesia’s population, affluence, and technology impact emissions in the power sector, highlighting the correlation between rising emissions from electricity production and economic development.
In applying the IPAT framework, it is only fair to start the analysis with Indonesia’s population. The most recent data suggests that 99.4% of the population has access to electricity (World Bank, n.d.-b). Although such a large energy-consuming population inevitably has an impact on greenhouse gas emissions, the population growth rate peaked in 1964 and has since been declining on average (World Bank, n.d-a). Between 1970 and 2023, the population grew roughly by 150% (i.e., 2.5 times larger), while total emissions increased by over 482% (Figure 1). This suggests that population alone is insufficient to account for rising emissions in the power sector; instead, economic development must also be considered.
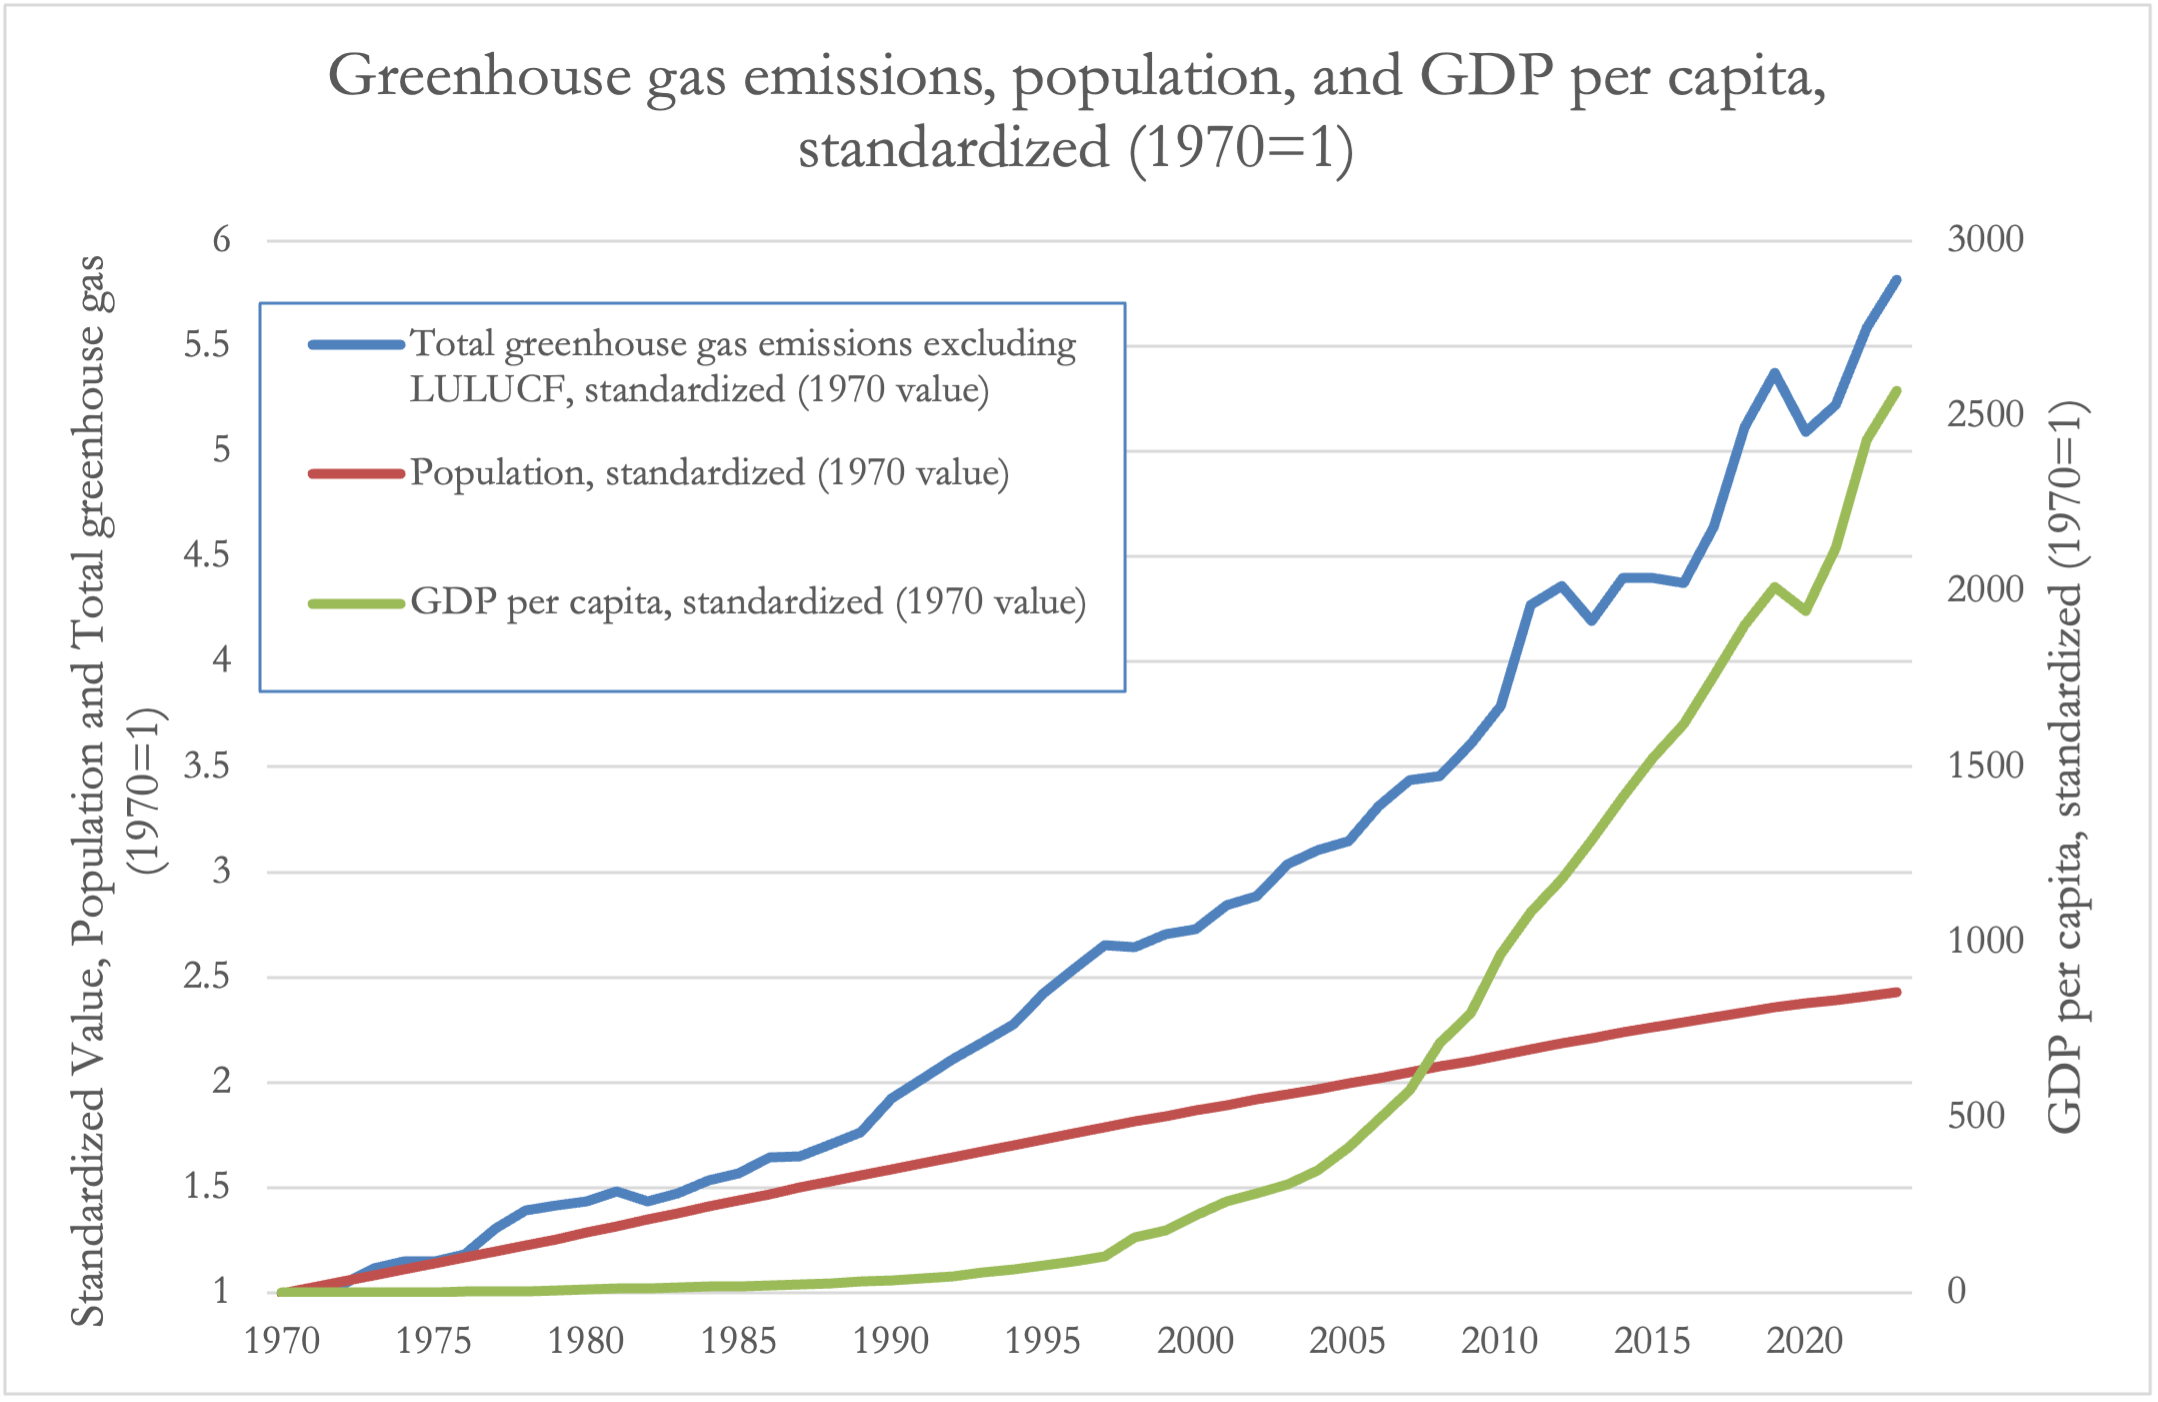
Figure 1. Indonesia’s Total Greenhouse Gas Emissions Excluding LULUCF (Mt CO2e) (EN.GHG.ALL.MT.CE.AR5), Population, total (SP.POP.TOTL) and GDP per capita (current LCU)(NY.GDP.PCAP.CN) from 1970 to 2023, standardized to 1970 =1 (World Bank, n.d-a). A secondary axis (right axis) was added for GDP per capita due to its much larger scale (an increase of over 2500 times) relative to emissions and population (left axis).
Following the IPAT framework, GDP per capita represents the nation’s affluence (A)—the impact associated with rising material comfort (Holdren, 1993). While Indonesia has experienced some major shifts in GDP per capita, growth became more stable in the 1970s and increased over 2500 times between 1970 and 2023 (secondary axis, Figure 1). A large component of rising emissions can be attributed to its 40% share of GDP derived from industry, including construction and manufacturing (World Bank, n.d.-b). These sectors demand large amounts of electricity and energy. Because Indonesia’s electricity production relies heavily on fossil fuels, this economic growth is not without environmental impact.
Finaly, the T in the IPAT framework—technology—is represented by carbon intensity, which for this assessment refers to greenhouse gas emissions from the power industry per unit of current local currency (LCU) of GDP. Between 2000 and 2023, there was a 364% increase in total electricity production (International Energy Agency, n.d.) and a 338% increase in GHG emissions from the power industry (World Bank, n.d.-a). This is demonstrated in Figure 2 with a high correlation between greenhouse gas emissions from the power industry and total electricity generation. This is due to the reliance on non-renewable sources, making electricity production a carbon-intensive process (Figure 3). While the use of certain non-renewable sources has declined, such as oil and natural gas, coal generation has increased by 781% from 2000 to 2023 (Appendix A). This reliance on fossil fuels for electricity implies that an increase in affluence will consistently result in higher emissions unless a transition to more renewable energy occurs.
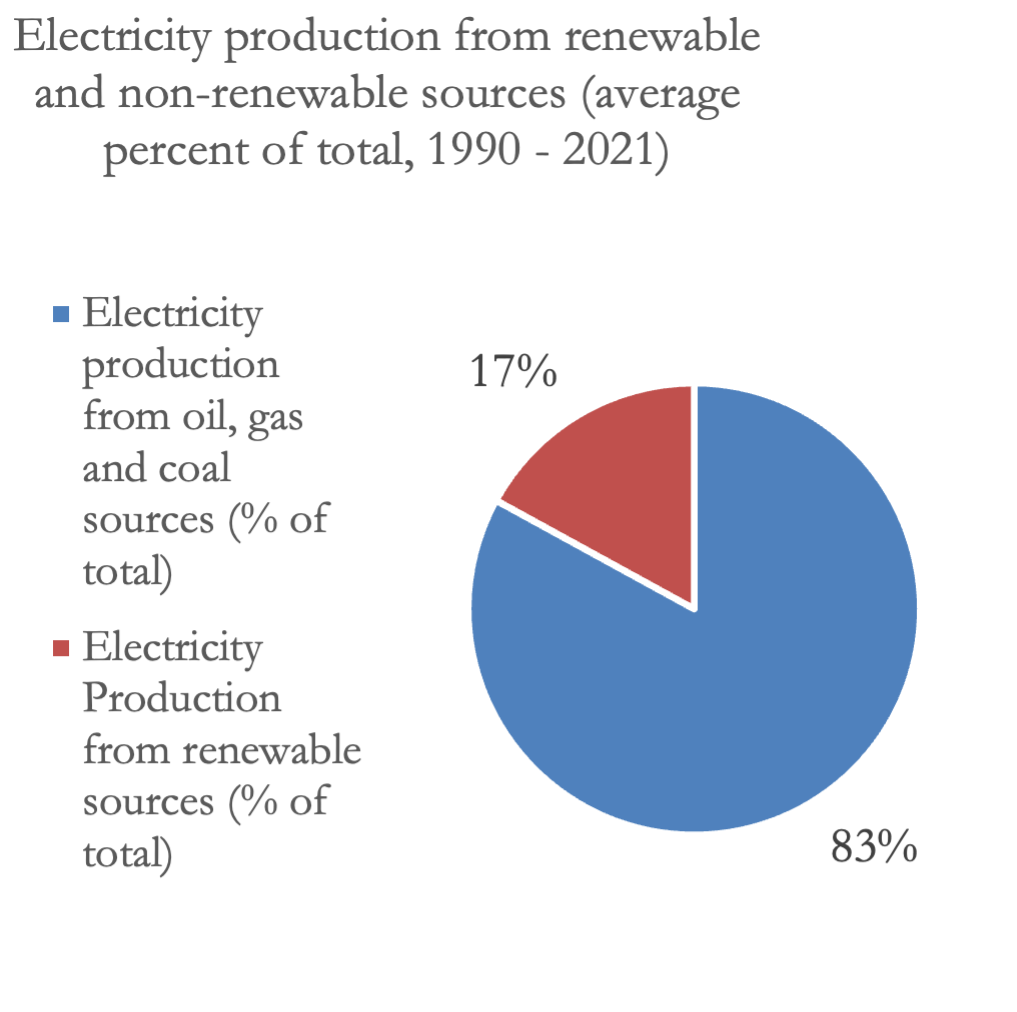
Figure 2. Electricity production from renewable sources, including hydroelectric (EG.ELC.RNWX.ZS) and non-renewable sources, including oil, gas, and coal as a percentage of total averaged over 1990 to 2021 (EG.ELC.FOSL.ZS) (World Bank, n.d.-a).
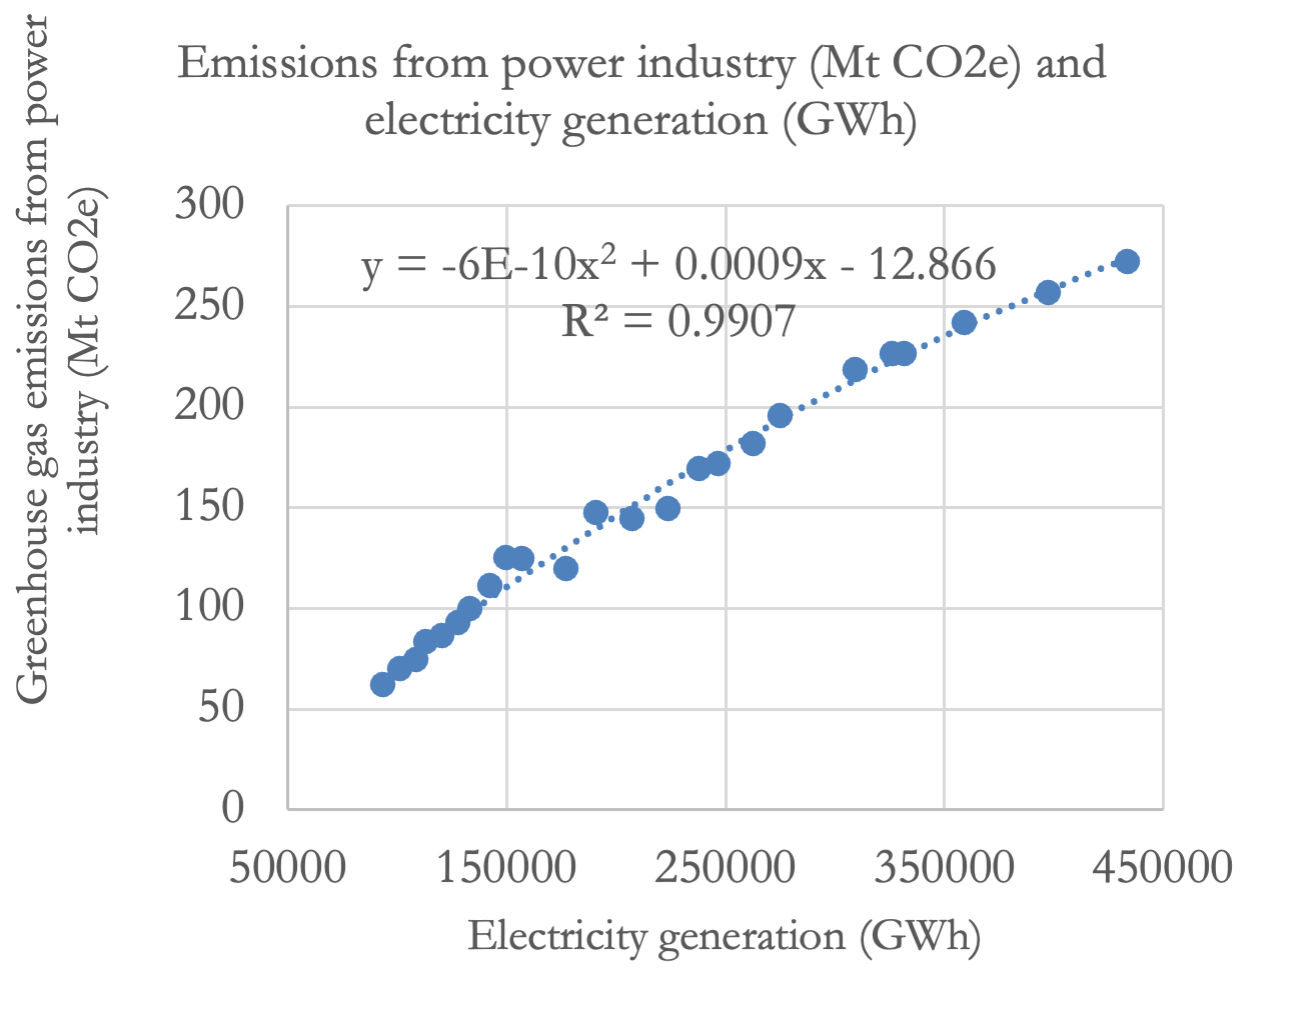
Figure 3. Electricity generation in GWh (International Energy Agency, n.d.) and Emissions from the power industry (CO2, CH4 and N2O) in Mt CO2e (sum of EN.GHG.CO2.PI.MT.CE.AR5, EN.GHG.CH4.PI.MT.CE.AR5, EN.GHG.N2O.PI.MT.CE.AR5) (World Bank, n.d.-a).
In conclusion, this commentary explored Indonesia’s power sector using the IPAT framework to highlight how population (P), affluence (A), and technology (T) all contribute to environmental impact (I). While population growth continues to increase electricity demand, it is not the primary force driving energy sector emissions; instead, economic growth plays a dominant role. Given Indonesia’s reliance on coal for power generation, it is unlikely that its Nationally Determined Contribution (NDC) target to reduce emissions by 32% against the 2030 baseline will be achieved (Climate Action Tracker, 2024). It is essential that Indonesia accelerate the implementation of renewable energy by aligning energy policy with climate goals (Setiawan et al., 2025). According to Diyono et al. (2023), the country does have the renewable resources needed to meet its domestic demand and its government’s goals. It is also important to acknowledge that while power generation is a starting point for improvement, emissions from land use, land use change, and forestry (LULUCF) are substantial and remain a significant risk (Appendix B).
The author conceptualized, wrote, and edited this work and takes full responsibility for the paper’s content, accuracy, and integrity. The author acknowledges using Chat GPT as a tool to provide insights into the topic and support readability and language. A detailed AI Usage Log for all contributors to this special issue is available as a separate PDF file.
Climate Action Tracker. (2024, December 10). Indonesia https://climateactiontracker.org/countries/indonesia/
Diyono, D., Cappon, H., Kujawa-Roeleveld, K., & Keesman, K. J. (2023). Designing Sustainable Domestic Electricity Supply from Renewable Energy Mixes: Application to Java and Bali, Indonesia. Energies, 16(22), 7461. https://doi.org/10.3390/en16227461
Ehrlich, P. R., & Holdren, J. P. (1971). Impact of Population Growth. Science, 171(3977), 1212–1217.
Holdren, J. P. (1993, September 7). A Brief History of “IPAT” (Impact= Population x Affluence x Technology). MAHB; Stanford University. https://mahb.stanford.edu/library-item/a-brief-history-of-ipat-impact-population-x-affluence-x-technology/
International Energy Agency. (n.d.). Indonesia - Countries & Regions. IEA. Retrieved September 24, 2025, from https://www.iea.org/countries/indonesia/emissions
Setiawan, A., Mardha Mentari, D., Firmansyah Hakam, D., & Saraswani, R. (2025). From Climate Risks to Resilient Energy Systems: Addressing the Implications of Climate Change on Indonesia’s Energy Policy. Energies, 18(9), 2389–2389. https://doi.org/10.3390/en18092389
Statista. (2025, August 5). Twenty countries with the largest population in 2025. https://www.statista.com/statistics/262879/countries-with-the-largest-population/
World Bank. (n.d.-a). Indonesia Data. Retrieved September 15, 2025, from https://data.worldbank.org/country/indonesia
 Tessa Angelis is a Thompson Rivers University student pursuing her Master of Science in
Environmental Economics. She holds a Bachelor of Business Administration and a Certificate in Corporate
Sustainability, both completed with distinction at the Beedie School of Business at Simon Fraser University.
Her professional experience in the British Columbia utility sector informs her research interests in
environmental and energy economics. Inspired by the beautiful nature scenes of British Columbia, Tessa is
passionate about conservation and sustainable development.
Tessa Angelis is a Thompson Rivers University student pursuing her Master of Science in
Environmental Economics. She holds a Bachelor of Business Administration and a Certificate in Corporate
Sustainability, both completed with distinction at the Beedie School of Business at Simon Fraser University.
Her professional experience in the British Columbia utility sector informs her research interests in
environmental and energy economics. Inspired by the beautiful nature scenes of British Columbia, Tessa is
passionate about conservation and sustainable development.
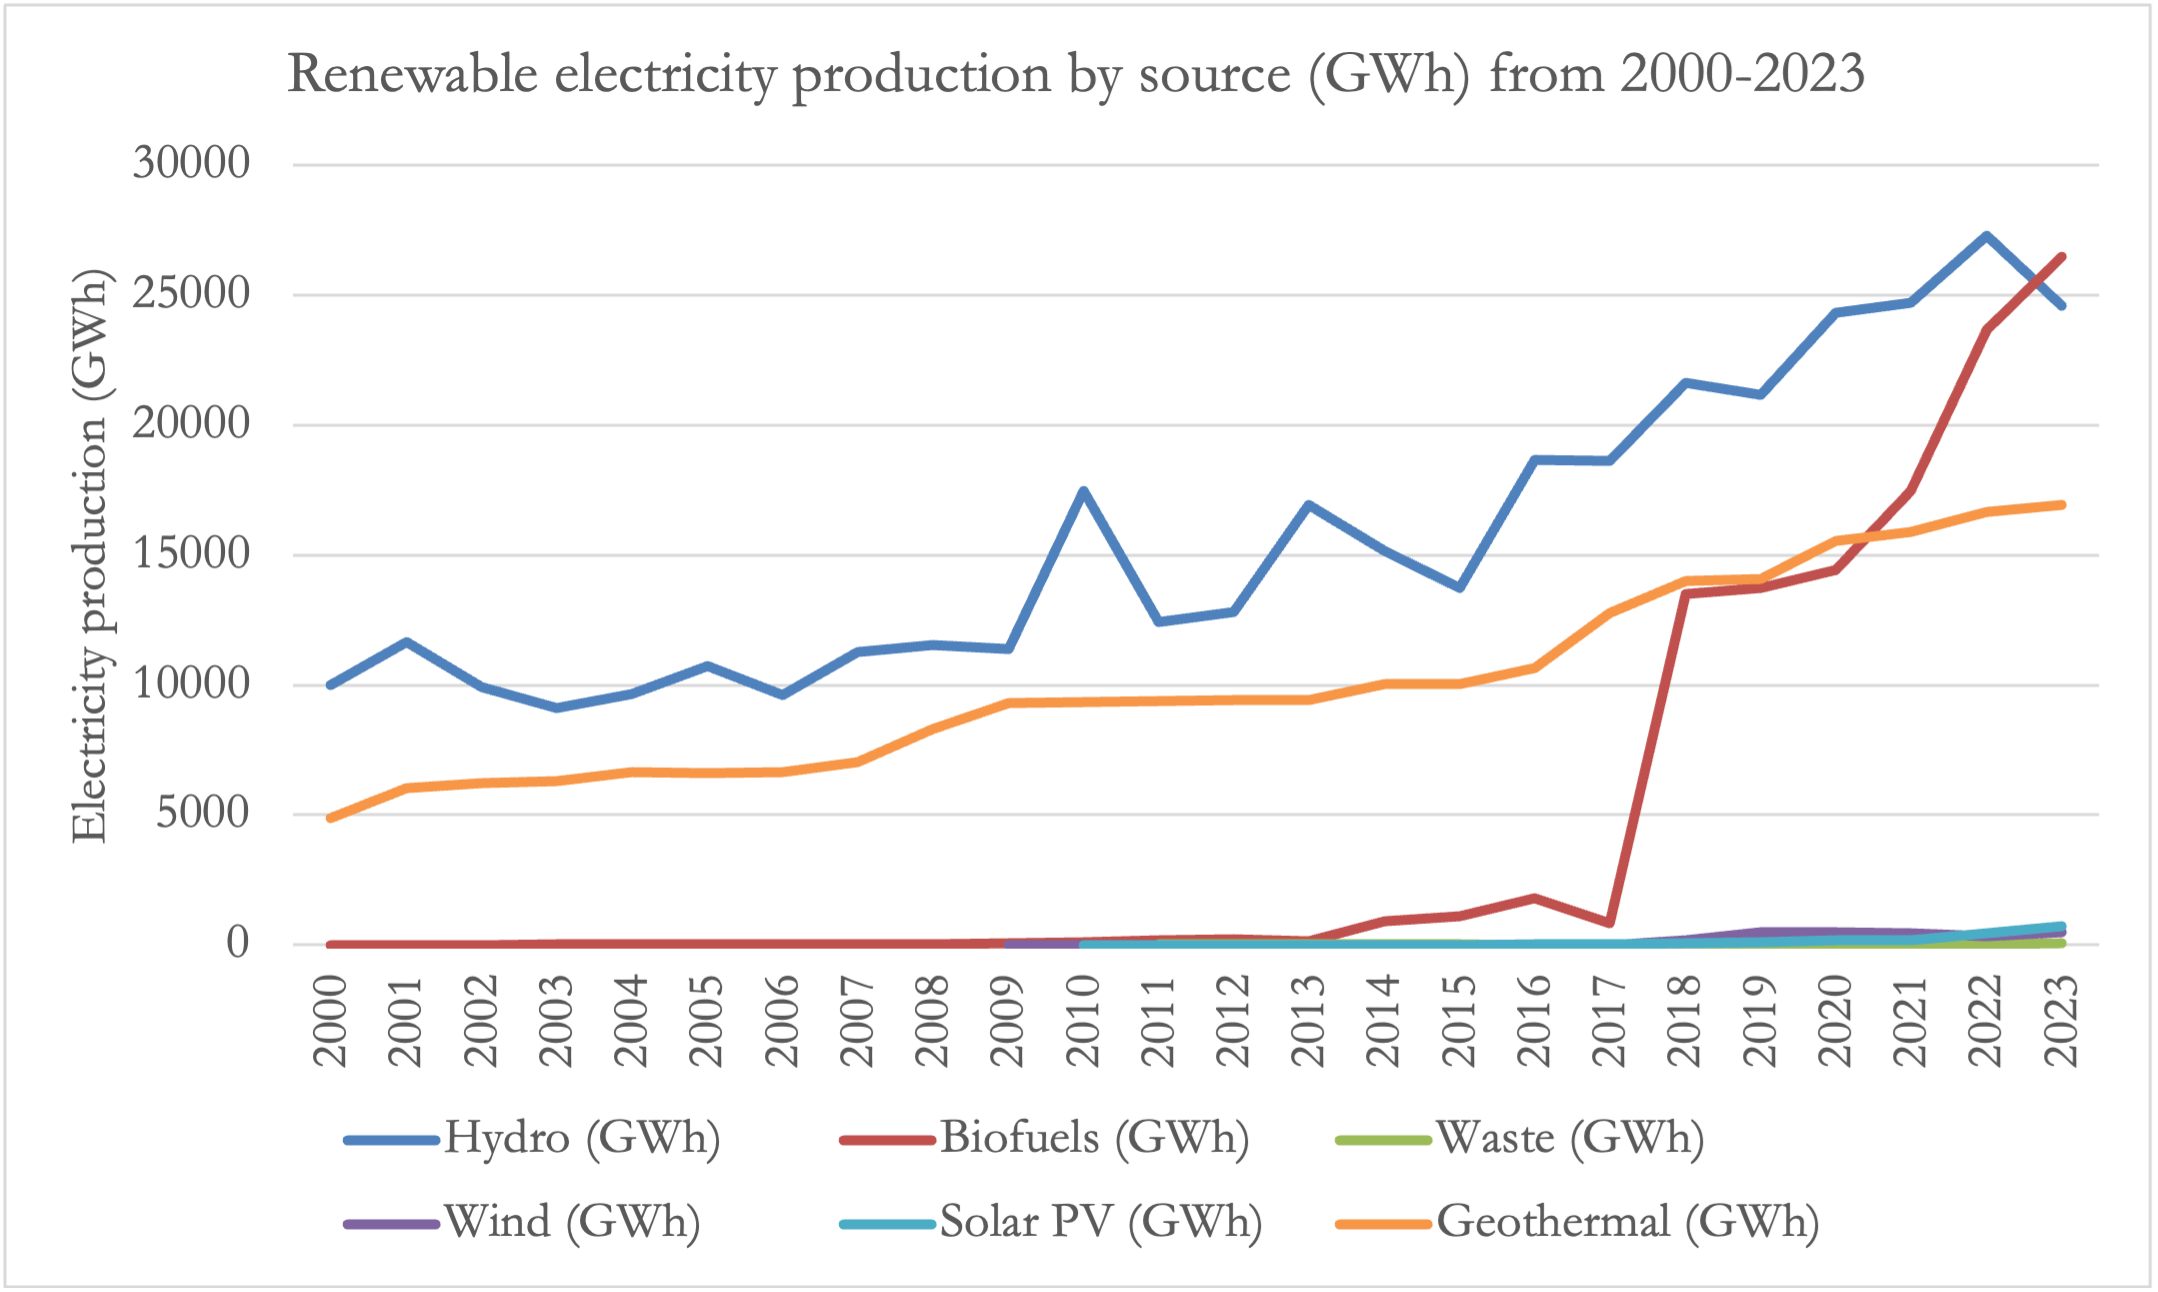
Figure A. Renewable electricity production by source (GWh) from 2000-2023 (International Energy Agency, n.d.).
Figure B. Non-renewable electricity production by source (GWh) from 2000-2023 (International Energy Agency, n.d.).
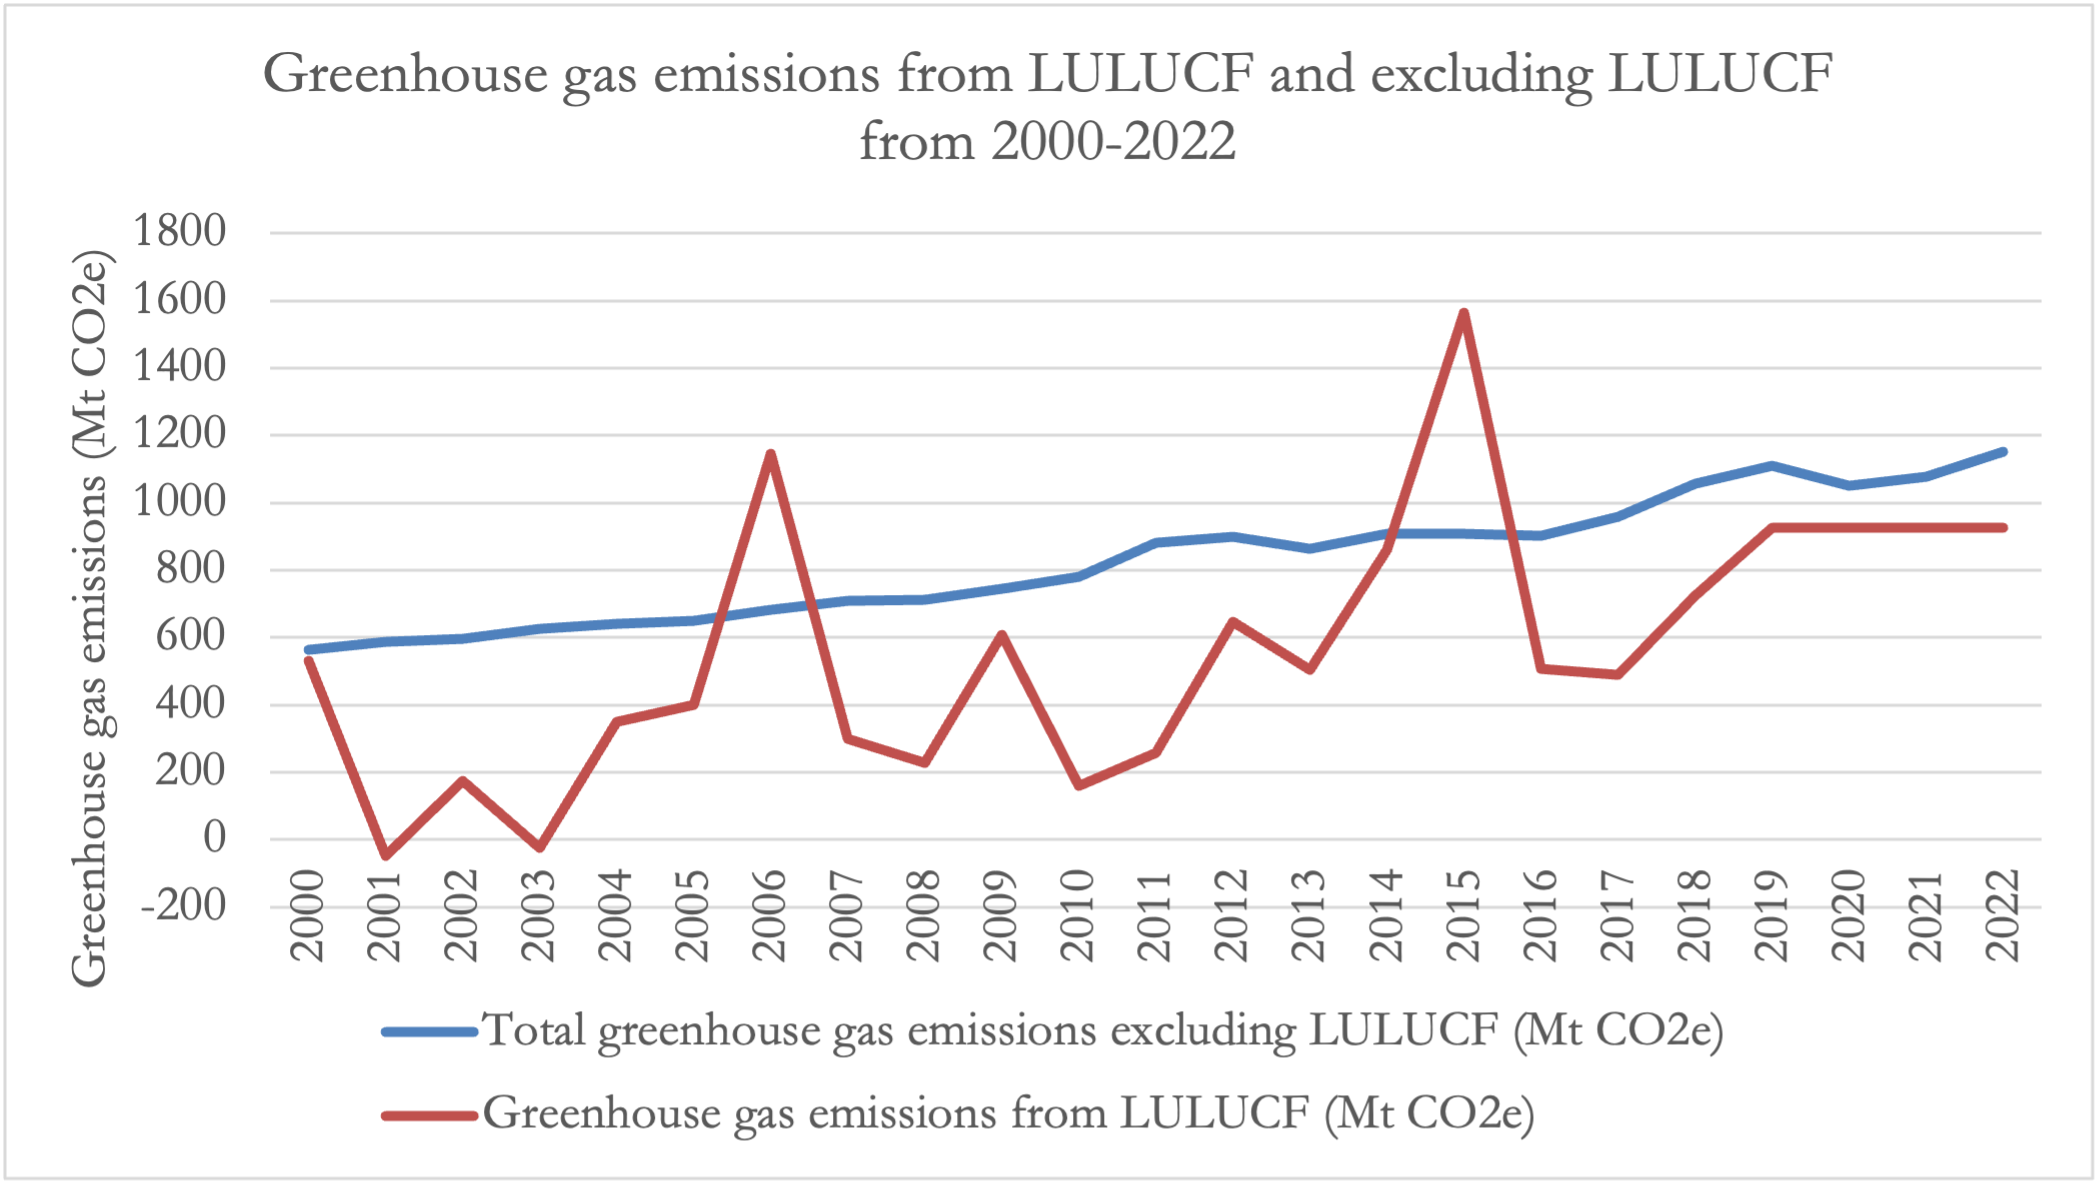
Figure C. Total greenhouse gas emissions excluding LULUCF (Mt CO2e) (EN.GHG.ALL.MT.CE.AR5) and greenhouse gas emissions from LULUCF (Mt CO2)(difference between EN.GHG.ALL.MT.CE.AR5 and EN.GHG.ALL.LU.MT.CE.AR5) (World Bank, n.d.-a).

This work is licensed under a Creative Commons
Attribution-NonCommercial-ShareAlike 4.0
International license