
India’s Economic Growth and Greenhouse Gas Emissions: A Kaya Identity Perspective
Thompson Rivers University
India’s growing population and economic expansion continue to drive its CO₂ emissions upward, while its relatively slow technological progress has not been sufficient to reverse this trend. To achieve a sustainable growth pattern, India must accelerate its transition toward renewable energy and further decouple its economy from carbon to ensure a low-carbon future.
The history of India’s greenhouse gas emission (GHG) dynamics over the last 30 years can be described as the typical interaction of three main factors—demographic increase, economic progress, and technological advancement—through the IPAT identity: I = P × A × T, in which I is environmental impact, P is population, A is affluence, and T is technology. This model explains why accelerated demographic growth and increasing living standards in India have contributed to rising carbon emissions in the country. The line graph below visually summarizes the trends and introduces key moments in India’s climate journey.
World Bank data show an increase in India’s population from about 960 million in 1997 to over 1.42 billion in 2023, along with a dramatic rise in GDP per capita, particularly since the 2000s. The increase in overall GHG emissions nearly doubled between the late 1990s and 2023.
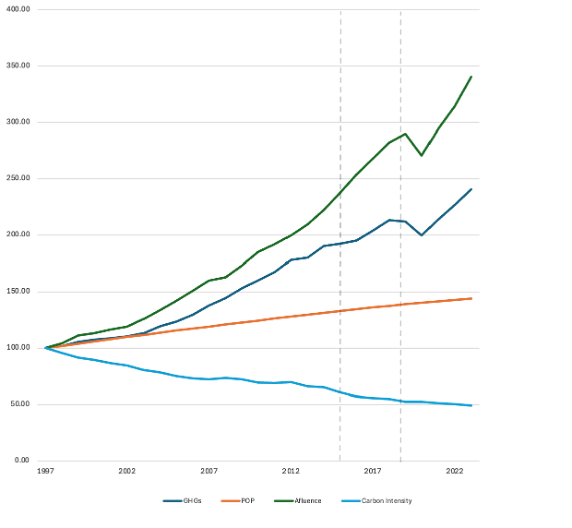
Figure 1. Total Greenhouse Gas Emissions Excluding LULUCF (MtCO2e) (EN.GHG.ALL.MT.CE.AR5), Total population (SP.POP.TOTL) and GDP per capita (constant LCU) (NY.GDP.PCAP.KN) from the World Bank data, 2024 indexed 200 in 1997
Carbon intensity declined by 50% between 1997 and 2023, indicating greater technological efficiency in producing goods and services (GDP). India has experienced a steady population growth, with an average annual growth (AAGR) of approximately 1.3% (1997-2014), slowing to roughly 1.0% (2015-2023). Despite the fact that growth is slowing down, the demographic scale remains an important cause of emissions. The birth rate continuing to exceed the death rate adds to India’s overall population, increasing resource demand and adding to carbon emissions. Population adds to the energy usage, infrastructure needs, and resource consumption, which in turn increases fossil fuel consumption, even as renewable energy deployment expands. GDP per capita has increased at a fast pace of 56%, most notably following 2003, and slowed slightly to 45% from 2015 to 2023 (World Bank, 2023).
| Period | Environmental Impact (I) | Population | Affluence (A) | Technology (T) |
|---|---|---|---|---|
| 1998-2023 | 3.56 | 1.52 | 4.94 | -2.85 |
| 1998-2015 | 3.63 | 1.58 | 4.80 | -2.75 |
| 2015-2023 | 2.81 | 1.00 | 4.50 | -2.69 |
The consistent economic growth in India has led to an increase in per capita income and consumption levels, and this increased wealth is directly related to increased energy consumption that is mainly obtained from fossil fuels. In 2020, GHG emissions in India were 68 per cent of power (energy, mostly coal), 20 per cent of industry (steel/ cement), 9 per cent of agriculture (CH4/N2O of rice/ livestock), 3 per cent of waste (landfills) and emerging inland waters (CO2/CH4 of reservoirs negating land sinks) (Philip Kuriakose, 2025, Garg et al., 2001, Patange et al., 2024, Sel).
Economic growth is an established driver of emissions, as total GHGs have increased 42% since 2010-2020 (notwithstanding COVID fall) and CH4 growth has been confirmed by atmospheric measurements to be stable: IPAT decomposition reveals that the decline in technology (2.85%/year) is insufficient to offset 4.94% affluence growth [Philip & Kuriakose, 2025; Ganesan et al., 2017; Bakr et al., 2022]. This implies that technological advancements help reduce the intensity of emissions. However, there is still a significant imbalance in the energy mix in India, as coal and petroleum are still the most relied-on sources of energy. The development of renewable energy and energy efficiency measures has not succeeded in offsetting demographic and economic growth (World Bank, 2023).
India’s per-capita emission (2.05 metric tons/person) is still well below the global average of 4.76 metric tons per person. In climate negotiations, this raises fairness questions about historical responsibility and development space, consistent with distributive justice perspectives. India’s climate policies reflect its efforts to balance rapid development with environmental sustainability, especially after the 2015 Paris Agreement (see Table 1). Initiatives like the National Solar Mission and the Perform Achieve Trade scheme promote renewable energy and energy efficiency across sectors (Government of India, 2024; IEA, 2023).
As of June 2025, India’s total installed power capacity stands at 476 GW. Of this, non-fossil fuel sources contribute 235.7 GW, approximately 50% of the total, including 226.9 GW of renewable energy and 8.8 GW of nuclear power. Despite ambitious renewable targets aiming for 500 GW by 2030, fossil fuels still supply around 50% of the 476 GW total installed power generation (Press Information Bureau, 2025). India’s Nationally Determined Contributions (NDCs) target a 45% reduction in emissions intensity by 2030 and net-zero by 2070 (UNFCCC, 2022), but only about 40% of the required measures are fully implemented (Climate Action Tracker, 2025).
The government emphasizes social equity through programs expanding clean energy access (Government of India, 2024), though challenges remain for coal-dependent workers (TERI, 2024). Internationally, India calls for enhanced climate finance and technology transfer reflecting equity concerns and the context of historical emissions (Climate Summit India, 2025; Climate Action Tracker, 2025).
The author contributed to the concept, writing, and editing and takes full responsibility for the paper’s content, accuracy, and integrity. The author acknowledges using Perplexity AI as a tool that provided insights into the topic and supported readability and language. Perplexity AI was also used for literature reviews. All errors, biases, and omissions remain the author’s, not the AI tools’. A detailed AI Usage Log for all contributors to this special issue is available as a separate PDF file.
Climate Action Tracker. (2025). India - Climate action progress. https://climateactiontracker.org/countries/india/
Garg, A., Bhattacharya, S., Shukla, P. R., & Dadhwal, V. K. (2001). Regional and sectoral assessment of greenhouse gas emissions in India. Atmospheric Environment, 35(15), 2679-2695. https://doi.org/10.1016/S1352-2310(00)00414-3
Government of India. (2024). India: National greenhouse gas inventory and mitigation policies. Ministry of Environment, Forest and Climate Change. https://moef.gov.in/
Grossman, G. M., & Krueger, A. B. (1995). Economic growth and the environment. The Quarterly Journal of Economics, 110(2), 353–377. https://doi.org/10.2307/2118443
International Energy Agency [IEA]. (2023). India Energy Transition Report. International Energy Agency. https://www.iea.org/countries/india/energy-mix
International Energy Agency [IEA]. (2023). India: Energy transition, carbon intensity, and renewable energy statistics. IEA Data and Statistics. https://www.iea.org/countries/india/energy-mix
Ohlan, R. (2015). The impact of population density, energy consumption, economic growth and trade openness on CO₂ emissions in India. Natural Hazards, 79(2), 1409–1428. https://doi.org/10.1007/s11069-015-1898-0
Patange, O., Purohit, P., Avashia, V., Klimont, Z., & Garg, A. (2024). Mitigation of non-CO2 greenhouse gases from the Indian agriculture sector. Environmental Research Letters, 19. https://doi.org/10.1088/1748-9326/ad4e4e
Philip, A., & Kuriakose, N. (2025). Trends and drivers of greenhouse gas emissions in India: A decadal analysis (2010–2020). Current World Environment. http://dx.doi.org/10.12944/CWE.19.3.26
Press Information Bureau. (2025, June 22). India’s energy landscape: Powering growth with sustainable energy [Press release]. Government of India. https://static.pib.gov.in/WriteReadData/specificdocs/documents/2025/jun/doc2025622575501.pdf
Selvam, P., Natchimuthu, S., Arunachalam, L., & Bastviken, D. (2014). Methane and carbon dioxide emissions from inland waters in India - implications for large-scale greenhouse gas balances. Global Change Biology, 20(7), 2340-2351. https://doi.org/10.1111/gcb.12575
TERI. (2024). Just transition challenges in India’s coal sector. The Energy and Resources Institute. https://www.teriin.org/project/just-transition-0
UNFCCC. (2022). India’s Nationally Determined Contributions. United Nations Framework Convention on Climate Change. https://unfccc.int/documents/611411
World Bank. (2023). India: Population, GDP per capita (constant US$), and greenhouse gas emissions. In DataBank: World Development Indicators. https://databank.worldbank.org/source/world-development-indicators

This work is licensed under a Creative Commons
Attribution-NonCommercial-ShareAlike 4.0
International license