
South Africa’s Paris Era Shift: Falling Emissions Since 2015, But Can 2030 Targets Be Met?
Thompson Rivers University
South Africa is often portrayed as a hard case for decarbonisation—coal‑heavy power, recurrent energy‑security challenges, and pressing socio‑economic priorities. Coal still supplies the bulk of the country’s electricity, and the system has faced frequent load‑shedding and infrastructure constraints in recent years (IEA, 2023; U.S. Department of Energy, 2024). Yet, the country’s carbon intensity of Gross Domestic Product (GDP) has improved meaningfully in the post-Paris Agreement era (Department of Forestry, Fisheries and the Environment, 2021; International Monetary Fund Statistics Department, 2024). Using the World Bank and Emissions Database for Global Atmospheric Research (EDGAR) estimates for total greenhouse gas emissions (GHG, excluding Land Use, Land-Use Change, and Forestry [LULUCF]), population, and constant-price GDP per capita for 1997–2023, I decompose emissions using the Kaya identity into population (P), affluence (A: GDP per capita), and technology (T: carbon intensity, expressed as kg CO2e per 1,000 GDP constant LCU). Average annual changes in each factor were estimated by fitting log-linear regressions of the natural log of each variable on year, converting the slope to a percentage rate. To assess robustness, I compared two subperiods (1997–2014 and 2015–2023) and conducted sensitivity checks excluding the 2008 global recession and the 2020 COVID-19 shock (World Bank, 2024b, 2024a, 2024c).
First, using a log‑linear trend approach, carbon intensity (T) declined by −1.98% per year during 2015–2023, compared to −1.31% per year in 1997–2014. Sensitivity checks confirm these patterns are not driven by single‑year shocks: excluding 2020 (COVID‑19) yields −2.02% per year, and excluding 2008 from the earlier period gives −1.33% per year. Second, despite population growth of about +1.4% per year after 2015, total GHG emissions fell −1.60% per year (−1.54% per year without 2020) due to economic turmoil with GDP per capita falling at a rate of approximately −1% per year, while in the earlier period of 1997-2014 emissions increased at a rate of almost 2% per year (driven by economic growth of over 3% per year). These findings are directionally consistent with official reporting: South Africa’s national inventory shows a 2017–2020 decline and a partial rebound thereafter, while the policy architecture has tightened—ratified Paris targets, an updated Nationally Determined Contribution (NDC), the first Biennial Transparency Report (BTR1), and the Climate Change Act (2024) to coordinate mitigation across sectors (Department of Forestry, Fisheries and the Environment, 2024; Ministry of Forestry, Fisheries and the Environment, 2025).
| Period | GHG (Mt[3] CO2e) (%) |
Population (%) | GDP per Capita (Constant LCU) (%) |
Carbon Intensity (kg CO2e per 1,000 LCU) (%) |
|---|---|---|---|---|
| 1997-2014 | +1.98 | +1.11 | +2.21 | −1.31 |
| 1997-2014 excl. 2008 | +1.94 | +1.12 | +2.17 | −1.33 |
| 2015-2023 | −1.60 | +1.43 | −1.03 | −1.98 |
| 2015–2023 excl. 2020 | −1.54 | +1.43 | −0.93 | −2.02 |
| 1997-2023 | +0.86 | +1.26 | +1.09 | −1.47 |
Note. Percentage per year; GHG = total GHG excluding LULUCF; intensity = kg CO2e[4] per 1,000 LCU
South Africa’s updated NDC commits to 350–420 Mt CO2e by 2030, roughly 3040% below 2005 levels[5]. With emissions at 522 Mt in 2023, achieving even the upper bound (420 Mt) in just seven years requires an annual reduction of about −3.0% per year, while the lower bound (350 Mt) demands −6.6% per year—both far steeper than the recent −1.6% per year trend. If reductions are delayed until after 2025, the required pace to hit 350 Mt jumps to nearly −9.8% per year, which is practically unattainable without severe economic disruption. Extending the horizon to 2050 lowers the required rate to about −1.8% per year, closer to historical performance and arguably more feasible.
Given these constraints, a phased approach—such as 40% below 2005 by 2040 and net zero by 2075—may be more realistic. Authorities could adopt rolling five-year reviews to adjust ambition while maintaining credibility. Because GDP and population are expected to grow, carbon intensity would need to decline even faster than emissions, reinforcing the urgency of accelerating renewable deployment and efficiency gains.
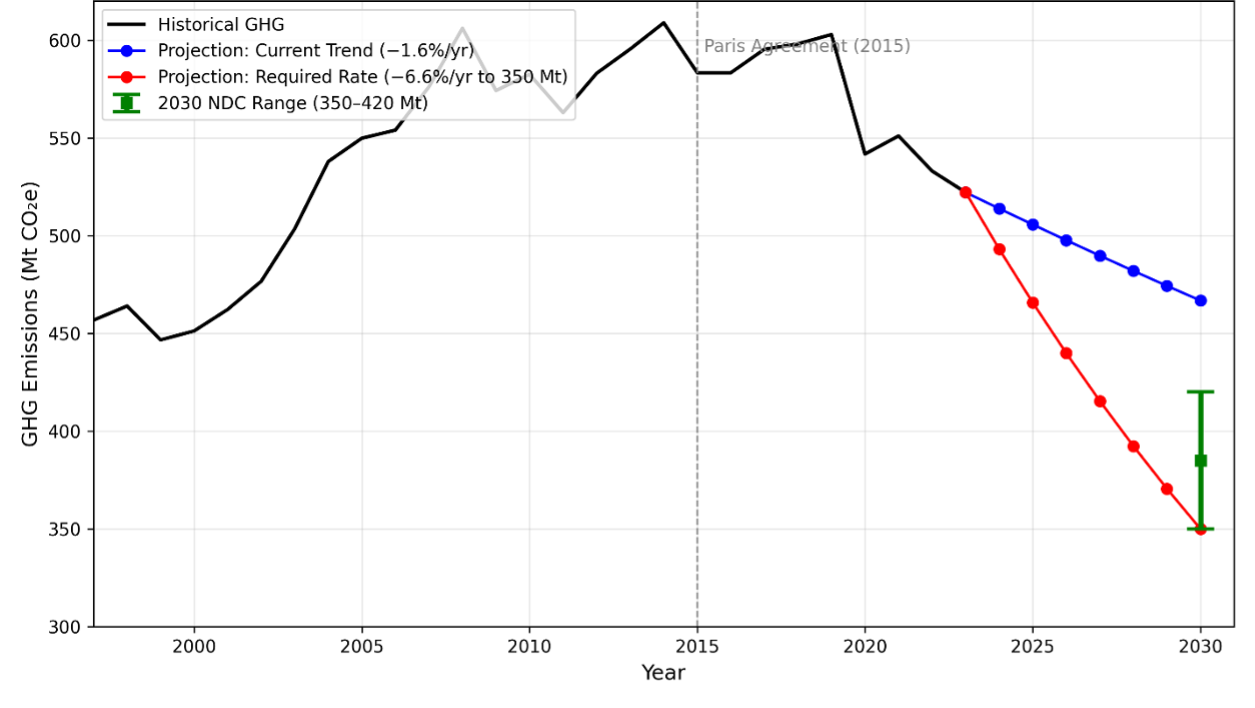
Figure 1. South Africa: Total GHG (excl. LULUCF), 1997-2023 and 2030 targets (Vertical line marks 2015, Paris Agreement)[6] (Created with Chat GPT 5)
What likely explains the observed Paris era break in carbon density (T)? South Africa’s carbon intensity decline after 2015 is linked to structural and policy shifts. The Integrated Resource Plan (IRP, 2019) set measurable targets to increase renewable energy share from 11% to 41% by 2030, reducing coal reliance from 80% to 51% through 17,742 MW of wind and 8,288 MW of solar PV capacity (Owusu-Mante, 2020). The Renewable Energy Independent Power Producer Procurement Programme (REIPPPP) has mobilized over USD 20 billion and added 6,200 MW of renewable capacity, signaling a pivot toward cleaner energy (Majenge et al., 2025). Additionally, the Climate Change Act (2024) introduces carbon budgets and sectoral emission targets, legally binding mitigation plans across high-emission sectors (South African Government, 2024). These measures, combined with carbon tax implementation and grid modernization, underpin the observed acceleration in carbon-intensity decline (T) .
This analysis uses World Bank World Development Indicators (WDI) data (EN.GHG.ALL.MT.CE.AR5) derived from EDGAR, which may differ from South Africa’s National Inventory Reports (NIR) due to methodological variations in sectoral coverage and LULUCF treatment (Ministry of Forestry, Fisheries and the Environment, 2025). While EDGAR ensures cross-country comparability, national inventories often incorporate more granular activity data. COVID-19 introduced a temporary emissions dip in 2020, complicating trend attribution; preliminary data show a rebound in 2021-2022, consistent with global patterns (Ministry of Forestry, Fisheries and the Environment, 2025).
South Africa’s greenhouse gas emissions have fallen since 2015, but the pace—about −1.6% per year—is far below what is needed to meet the updated 2030 NDC target of 350–420 Mt CO2e, which would require reductions of 3–7% per year depending on the ambition level. Without an unprecedented acceleration in decarbonization, the 2030 goal appears unattainable. A pragmatic pathway could involve extending the timeline (e.g., 40% below 2005 by 2040, net zero by 2075) while maintaining interim checkpoints. Sustaining progress will demand deeper policy enforcement, faster renewable integration, and sharper carbon intensity improvements to offset economic and demographic growth.
Chat GPT AI version 5 was used as a support tool for data verification, visualization, and revision. All outputs were verified and edited by me to ensure accuracy and academic integrity. AI did not replace critical thinking or final judgment. A detailed AI Usage Log for all contributors to this special issue is available as a separate PDF file.
Department of Forestry, Fisheries and the Environment. (2021, February 3). Implementing Paris Agreement; Carbon tax and carbon budgets: DEFF briefing; with Minister. Parliamentary Monitoring Group [PMG]. https://pmg.org.za/committee-meeting/32417/
Department of Forestry, Fisheries and the Environment/ Republic of South Africa. (2024). South Africa’s first biennial transparency report (BTR1) [PDF]. To the United Nations framework convention on climate change under the Paris Agreement. UNFCCC. https://unfccc.int/sites/default/files/resource/First%20Biennial%20Transparency%20Report%20of%20South%20Africa%20under%20the%20PA_20%20December%202024.pdf
International Energy Agency [IEA]. (2023). South Africa—Countries & Regions. IEA. https://www.iea.org/countries/south-africa
International Monetary Fund. Statistics department. (2024). South Africa: Technical assistance report- report on macro-relevant climate change statistics diagnostic mission (July 17–21, 2023). Technical Assistance Reports, 2024(014). https://doi.org/10.5089/9798400267338.019
Majenge, L., Mpungose, S., & Msomi, S. (2025). Threshold effects on South Africa’s renewable energy–economic growth–Carbon dioxide emissions nexus: A nonlinear analysis using threshold-switching dynamic models. Energies, 18(17), 4642. https://doi.org/10.3390/en18174642
Ministry of Forestry, Fisheries and the Environment. (2025). 9th national greenhouse gas inventory report, 20002022 [PDF]. https://www.dffe.gov.za/sites/default/files/legislations/nemaq_nggireportt_g52067gon5850.pdf
Owusu-Mante, S. (2020, May 13). South Africa’s 2019 IRP renewable energy targets. Climate Policy Lab. https://www.climatepolicylab.org/communityvoices/2020/5/13/south-africas-2019-irp-renewable-energy-targets
South Africa. (2021). South Africa’s updated first nationally determined contribution under the Paris Agreement: Updated September 2021 [PDF]. United Nations Framework Convention on Climate Change. https://unfccc.int/sites/default/files/NDC/2022-06/South%20Africa%20updated%20first%20NDC%20September%202021.pdf
South African Government. (2024). Climate Change Act 22 of 2024 (English/Tshivenda). https://www.gov.za/sites/default/files/gcis_document/202407/50966climatechangeact222024.pdf
U.S. Department of Energy. (2024). Country analysis brief: South Africa [PDF]. (Last updated: October 29, 2024). https://www.eia.gov/international/content/analysis/countries_long/South_Africa/pdf/SAfrica_CAB_FY24_final.pdf
World Bank. (2024a). GDP per capita (constant LCU)—South Africa. World Bank Open Data. https://data.worldbank.org/indicator/NY.GDP.PCAP.KN?locations=ZA
World Bank. (2024b). Population, total—South Africa. World Bank Open Data. https://data.worldbank.org/indicator/SP.POP.TOTL?locations=ZA
World Bank. (2024c). Total greenhouse gas emissions excluding LULUCF (Mt CO2e)—South Africa. World Bank Open Data. https://data.worldbank.org/indicator/EN.GHG.ALL.MT.CE.AR5?locations=ZA
Impact = Population × Affluence × Technology 1
Sources: World Bank WDI- EN.GHG.ALL.MT.CE.AR5 (EDGAR Community GHG), SP.POP.TOTL, NY.GDP.PCAP.KN. 2
Carbon Dioxide Equivalent 3
Million tonnes 4
South Africa. (2021). South Africa’s updated first nationally determined contribution under the Paris Agreement: Updated September 2021 5
Sources: World Bank WDI- EN.GHG.ALL.MT.CE.AR5 (EDGAR Community GHG), SP.POP.TOTL, NY.GDP.PCAP.KN. 6

This work is licensed under a Creative Commons
Attribution-NonCommercial-ShareAlike 4.0
International license