
Australia’s 2030 Target Gap and the Role of LULUCF: An IPAT Analysis
Thompson Rivers University
Under the 2016 Paris Agreement, Australia committed to reducing emissions to 43% below 2005 levels by 2030 and aims to be net zero (including LULUCF) by 2050. This commitment is part of the global effort to limit warming to below 2°C (Department of Climate Change, Energy, the Environment and Water, 2025). This short commentary applies the IPAT model to assess how population, affluence, and carbon intensity drive GHG impacts.
Australia celebrated 26 years of uninterrupted economic growth from 1991 to 2017 (Leal et al., 2019), reflected in rising affluence. However, it is a country with extensive non-renewable resources such as coal, oil, and natural gas (Leal et al., 2019). The electricity sector is the largest emitter, with coal accounting for roughly two-thirds of all electricity generation, resulting in Australia having the highest CO2 emissions per capita in 2019 (OECD, 2019). Additionally, Australian CO2 emissions account for 1.33% of total global emissions, with 0.97% originating from the electricity sector (Ahmed et al., 2021). As the largest emitter, the electricity sector significantly drives overall GHG growth.
Historical trends presented in Table 1 from 19702023 show a 1.12% average annual growth (AAG) in total GHG emissions, a 1.43% AAG in population, a 1.57% AAG in GDP per capita, and a 1.87% AAG in Carbon intensity. A negative carbon intensity growth rate means GDP is growing faster than emissions. When examining observed trends since signing the Paris Agreement in 2015, total GHG emissions have been falling at an average annual rate of 0.64% and carbon intensity has decreased at an average annual rate of 3.08%.
Reducing emissions to 43% below 2005 levels will require a significant reduction in total GHG emissions. Based on the calculations shown in Table 1, to meet the 2030 target beginning in 2015, total GHG emissions should have decreased at an annual rate of 3.75% per year, and the annual carbon intensity rate should have been 6.74%. Since the observed rates missed this target, Australia must cut GHG emissions by 7.87%, and carbon intensity must fall by 10.875% per year from 20242030 to make up the difference.
| Trends | Period | Total GHG Emissions (CO2e)2 Growth Rate[1] | Population Growth Rate[2] | GDP per capita growth rate[3] | Carbon Intensity Growth Rate |
|---|---|---|---|---|---|
| Historical[4] | 1970-2023 | 1.12 | 1.43 | 1.57 | -1.87 |
| Target for 2030, starting in 2015 | 2015-2030 | -3.75 | 1.43 | 1.57 | -6.74 |
| Observed within Target Period | 2015-2023 | -0.64 | 1.41 | 1.03 | -3.08 |
| To hit Target in 2030 from 2023 | 2024-2030 | -7.87 | 1.43 | 1.57 | -10.87 |
Note. The Population growth and GDP per capita growth are assumed to grow at the historical rate.
The data presented in Table 1 analyze total GHG emission growth rates in Australia excluding Land Use, Land-Use Change, and Forestry (LULUCF). The Government of Australia projects that emissions including LULUCF will fall to 42.6% below 2005 levels by 2030 (Climate Action Tracker, 2025). When LULUCF emissions are taken into consideration, total emissions would need to decrease at an annual rate of 4.7% and carbon intensity would need to fall by 7.5% annually.
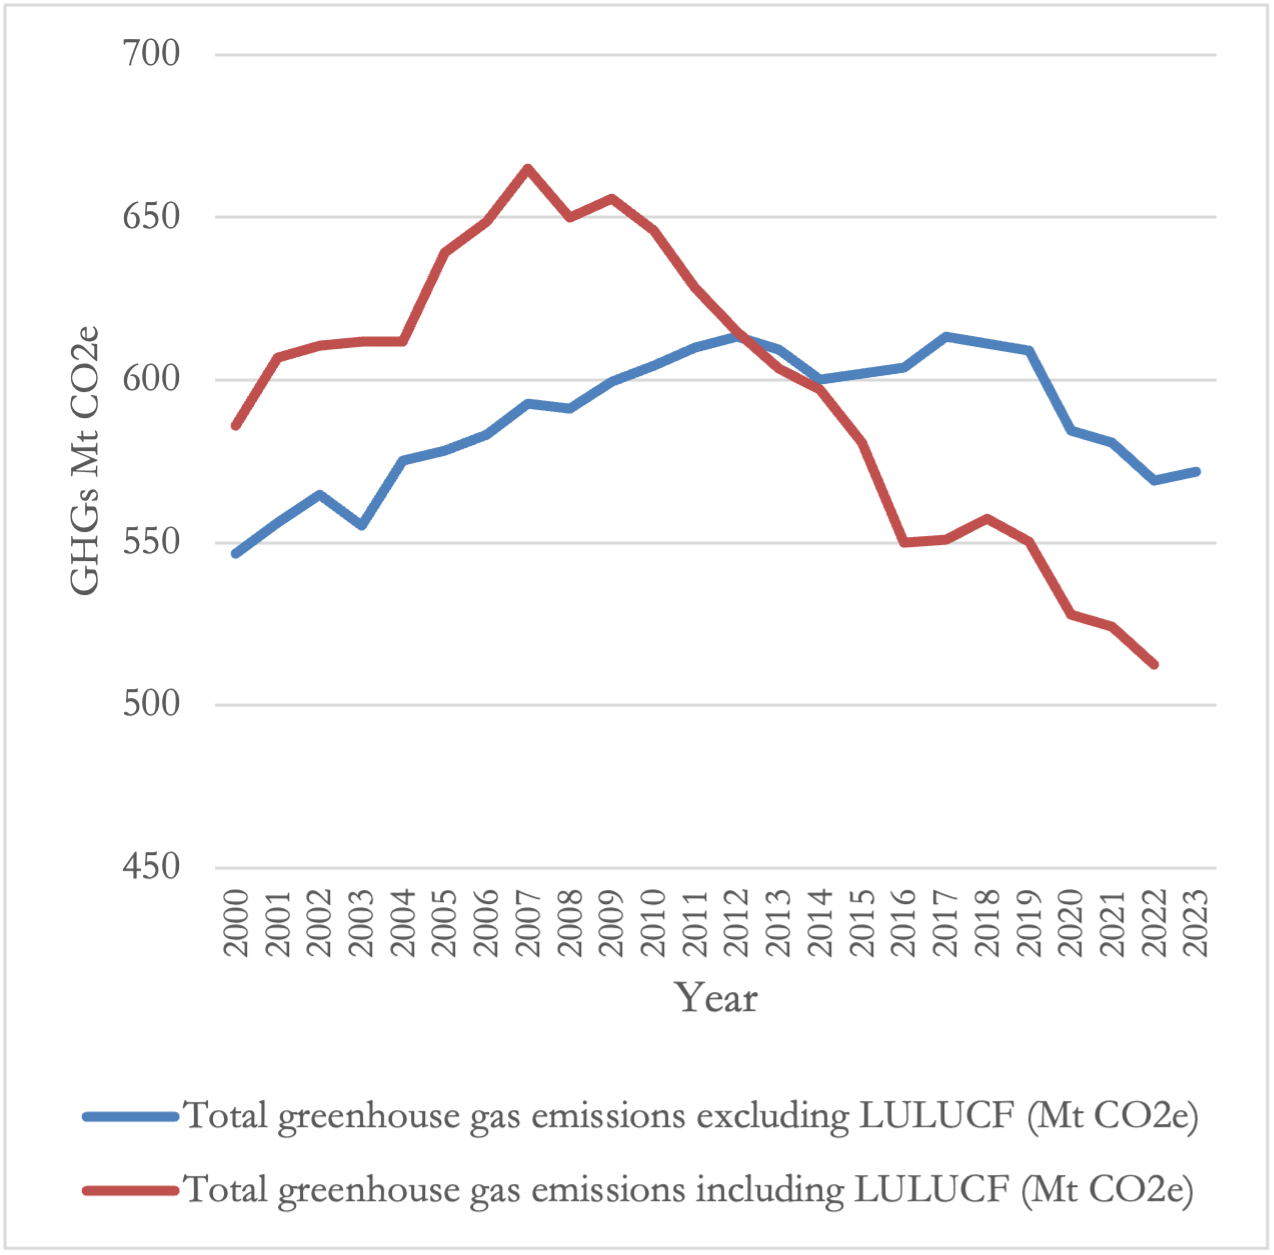
Figure 1: Emissions Excluding LULUCF Compared to Emissions Including LULUCF in Australia
Figure 1 depicts how emissions including LULUCF are lower than emissions excluding LULUCFs, meaning LULUCF has acted as a carbon sink since 2010. Although LULUCF is a carbon sink, fire-related forest loss has accounted for 41% of total global forest loss over the past two decades, weakening the global land carbon sink (Huang et al., 2025). The largest source of global carbon emissions (excluding fossil fuels) is fires, and despite strategic forest maintenance, Australia experienced massive fires in 20192020 that emitted significant amounts of CO2 into the atmosphere (Shiraishi & Hirata, 2021). Reliance on LULUCF to reduce emissions and provide a carbon sink could cause problems in the future, with more frequent droughts and extreme heat becoming increasingly more prominent (Shiraishi & Hirata, 2021).
Given the evidence presented in this perspective, Australia will not be able to meet its 2030 emissions target. Reductions of GHG emissions including LULUCF at over 4% per year are not possible with the current energy sources and infrastructure of the economic systems. Although reliance on coal has dropped (International Energy Agency, n.d.) and an investment of $3.27 billion (AUD) has been made on low-carbon liquid fuels, solar installations, and emissions reductions (Department of Climate Change, Energy, the Environment and Water, 2025), additional reductions would be costly and could drive the economy into a deep recession. Australia should focus on its 2050 target to be net zero starting immediately. Significant reductions will require strong policy and investment to sustain historic affluence and population growth. The policies currently in place are generally aligned with the 2050 target but will require consistent funding (Department of Climate Change, Energy, the Environment and Water, 2025; Leandro, 2024).
The author of this paper would like to thank Professor Peter Tsigaris for his thoughtful guidance and constructive feedback, which substantially improved the quality and clarity of this work.
The author of this paper contributed to the concept, writing, and editing, and takes full responsibility for the paper’s content, accuracy, and integrity. The author acknowledges using OpenAI’s ChatGPT as a tool that provided insights into the topic and supported readability and language. All errors, biases, and omissions remain the author’s, not the AI tool’s.
Ahmed, K., Apergis, N., Bhattacharya, M., & Paramati, S. R. (2021). Electricity consumption in Australia: the role of clean energy in reducing CO~~2~~ emissions. Applied Economics, 53(48), 5535–5548. https://doi.org/10.1080/00036846.2021.1925080
Climate Action Tracker. (2025, June 11). Australia: Policies & action. https://climateactiontracker.org/countries/australia/policies-action/
Department of Climate Change, Energy, the Environment and Water. (2024, November). Carbon leakage review: Consultation paper 2 – November 2024. https://consult.dcceew.gov.au/carbon-leakage-review-consultation-paper-november-2024
Department of Climate Change, Energy, the Environment and Water. (2025, September 17). Electricity and energy sector plan. https://www.dcceew.gov.au/climate-change/emissions-reduction/net-zero/electricity-and-energy-sector-plan
Department of Climate Change, Energy, the Environment and Water. (2025, August 11). International climate action. https://www.dcceew.gov.au/climate-change/international-climate-action
Forsell, N., Korosuo, A., Gusti, M., Rüter, S., Havlik, P., & Obersteiner, M. (2019). Impact of modelling choices on setting the reference levels for the EU forest carbon sinks: How do different assumptions affect the country-specific forest reference levels? Carbon Balance & Management, 14(10), N.PAG. https://doi.org/10.1186/s13021-019-0125-9
Huang, K., Wu, X., Zhang, L., Geng, H., & Qu, Y. (2025). Increasing risk of global forest loss from extreme wildfires under climate change. International Journal of Digital Earth, 18(1), 1–18. https://doi.org/10.1080/17538947.2025.2483982
Leal, P. A., Marques, A. C., & Fuinhas, J. A. (2019). Decoupling economic growth from GHG emissions: Decomposition analysis by sectoral factors for Australia. Economic Analysis and Policy, 62, 12–26. https://doi.org/10.1016/j.eap.2018.11.003
Leandro, A. (2024). Achieving the transition to net zero in Australia (OECD Economics Department Working Paper No. 1794). OECD Publishing. https://doi.org/10.1787/9a56c9d2-en
OECD (The Organisation for Economic Co-operation and Development). (2019.). “OECD Environmental Performance Reviews: Australia.” Organisation for Economic Co-operation and Development. accessed 18 June 2019. https://doi.org/10.1787/9789264310452-en.
Shiraishi, T., Hirata, R. Estimation of carbon dioxide emissions from the megafires of Australia in 2019–2020. Scientific Reports, 11, 8267 (2021). https://doi.org/10.1038/s41598-021-87721-x
The World Bank. (n.d.). Australia. In World Bank Open Data. Retrieved September 10, 2025, from https://data.worldbank.org/country/australia
Data is obtained from the World Bank using indicator name Total greenhouse gas emissions excluding LULUCF (MtCO2e) and code EN.GHG.ALL.MT.CE.AR5 1
Data is obtained from the World Bank using indicator name Population, total and code SP.POP.TOTL 2
Data is obtained from the World Bank using indicator name GDP per capita (constant LCU) and code NY.GDP.PCAP.KN 3
Data from 2020 and 2021 has been excluded to remove inconsistencies due to the COVID-19 pandemic 4

This work is licensed under a Creative Commons
Attribution-NonCommercial-ShareAlike 4.0
International license