
Absolute Decoupling in the United States After 2015: Declining Emissions With Economic Growth
Thompson Rivers University
The United States is historically the largest cumulative emitter of greenhouse gases, responsible for approximately 25% of all historical CO₂ emissions since the Industrial Revolution (IPCC, 2021). The United States' trajectory since the 1997 Kyoto Protocol and the 2015 Paris Agreement has attracted significant attention, as Democrats have generally favored participation in such international climate accords while Republicans have often resisted or withdrawn due to economic, regulatory, and sovereignty concerns. This commentary investigates whether the Paris Agreement marked a turning point in U.S. carbon intensity, testing the hypothesis that the United States experienced accelerated absolute decoupling after 2015, with CO₂ emissions declining despite continued growth in GDP. Using the IPAT/Kaya framework, this analysis examines drivers of U.S. emissions and compares pre- and post-2015 trends.
Data on population, GDP per capita (constant 2011 international dollars, PPP-adjusted), and CO₂ emissions (million tonnes, excluding land-use change) are drawn from Our World in Data's CO₂ and Greenhouse Gas Emissions Dataset, which consolidates data from the Global Carbon Project, World Bank World Development Indicators, and the U.S. Energy Information Administration (EIA). The analysis constructs the Kaya identity variables: Population (P), Affluence (A), Carbon Intensity (T), and Emissions (C). For each series, average annual growth rates (AAGR) are calculated for two periods: 1997–2014 and 2015–2023.
| Period | Recessions Removed | Presidents | CO₂ (%) | Population (%) | GDP per Capita (%) | Carbon Intensity (%) |
|---|---|---|---|---|---|---|
| 1997–2014 | None | Clinton/Bush/Obama | –0.19 | 0.94 | 1.46 | –2.60 |
| 1997–2014 | 2008, 2009 | Excl. recession | 0.46 | 0.95 | 1.91 | –2.40 |
| 2011–2017 | None | Obama years | –1.53 | 0.77 | 1.45 | –3.75 |
| 2015–2023 | None | Obama/Trump/Biden | –1.26 | 0.59 | 1.81 | –3.66 |
| 2015–2023 | 2020, 2021 | Excl. COVID | –1.00 | 0.68 | 1.88 | –3.56 |
The results support the hypothesis, though with important qualifications. The U.S. achieved absolute decoupling, as emissions fell while affluence and population continued to rise. However, the data reveal that the steepest declines in carbon intensity began prior to the Paris Agreement, especially from 2011 onward during the Obama administration after the Great Recession, when the U.S. electricity sector shifted from coal toward natural gas and renewables. The data show partial rather than definitive support for the Paris Agreement as a turning point because: (1) absolute decoupling was already underway by 2011–2017, with emissions declining at –1.53% annually during the Obama years, a faster rate than the post-2015 period (–1.00% annually); and (2) while carbon intensity continued declining after 2015 (–3.66% annually), this rate was slightly weaker than the pre-Paris Obama-era rate (–3.75% annually). Thus, the Paris Agreement reinforced, but did not originate, the U.S. decarbonization trend.
Research by Feng et al. (2015) found that between 2007 and 2009, 83% of U.S. emissions decline was due to recession-driven economic factors, whereas between 2011 and 2013, structural changes in production, consumption patterns, and fuel mix became increasingly important drivers. Cooper et al. (2016) documented that U.S. electricity generation from coal decreased from 2,016 TWh in 2007 to 1,514 TWh in 2012, while natural gas generation grew from 897 to 1,226 TWh, and CO₂ emissions from the electricity sector fell from 2,426 to 2,029 Mt. The Obama administration oversaw significant progress: U.S. carbon dioxide emissions from the energy sector fell by 9.5% between 2008 and 2015, reaching their lowest level in 25 years by mid-2016 (CEA, 2016). Renewable energy capacity from non-hydro resources tripled during this period, with wind and solar generation increasing dramatically.
By contrast, the post-2015 period shows continued but slightly slower reductions. The Clean Power Plan (2015), later stayed by the Supreme Court and repealed, along with federal tax credits for wind and solar through the Production Tax Credit and Investment Tax Credit, and state-level renewable portfolio standards, reinforced the decarbonization trend (Aldy et al., 2023). Yet energy prices also played a critical role, with inexpensive shale gas displacing coal during the 2007–2014 period (Weber & Clavin, 2012; Jiang et al., 2011). COVID-19 introduced a temporary decline in 2020, but emissions rebounded without returning to pre-2015 trajectories, leaving the long-term decline intact.
Comparing drivers, improvements in carbon intensity dominate the U.S. emissions trajectory, while population growth and GDP per capita exert upward pressure. Without the intensity decline improvements, U.S. emissions would have continued rising. The evidence therefore shows that structural energy transitions, rather than demographic or affluence effects, explain observed decoupling.
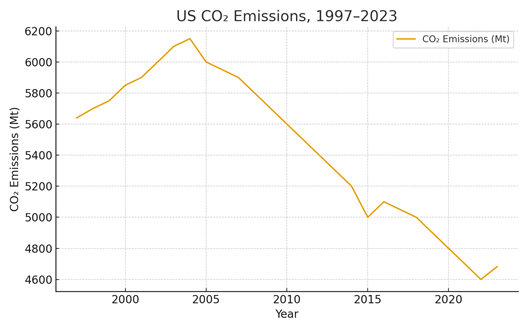
Figure 1. U.S. CO2 Emissions, 1997–2023. (Source: Our World in Data CO2 Dataset (2024), based on Global Carbon Project territorial emissions data (variable: CO2, measured in million tonnes, excluding land-use change). Data repository: github.com/owid/co2-data. Visualization created using ChatGPT-4o assistance.
Under the Paris Agreement, the United States initially committed to reducing greenhouse gas emissions by 26–28% below 2005 levels by 2025. This target was subsequently strengthened when President Biden's updated Nationally Determined Contribution (NDC) pledged a 50–52% reduction below 2005 levels by 2030. According to Climate Action Tracker (2024), the United States is currently rated "Insufficient" in meeting its climate commitments, with projected 2030 emissions falling short of the stated target even with full implementation of existing policies including the Inflation Reduction Act.
Current projections suggest that without additional policy measures, U.S. emissions will decline by approximately 32–43% below 2005 levels by 2030, representing significant progress but remaining insufficient to meet the 50–52% target (Climate Action Tracker, 2024). The Inflation Reduction Act of 2022 represents the most substantial federal climate investment in U.S. history, though its long-term impact remains uncertain given political dynamics.
Looking toward 2040, most modeling scenarios suggest continued emissions decline due to momentum from state-level policies, market forces favoring renewable energy, and declining costs of clean technologies. However, the pace of reduction is projected to slow without sustained federal support and additional policy interventions, making achievement of longer-term net-zero goals by 2050 increasingly challenging.
The United States has experienced sustained absolute decoupling of CO₂ emissions from GDP since the late 2000s. The "golden years" of U.S. climate action occurred during the Obama administration (2011–2017), when structural shifts in the electricity sector, renewable energy expansion, and fuel economy standards drove significant emissions reductions after the Great Recession. While emissions continued to fall after the Paris Agreement, the pace of intensity reduction was slightly stronger in the pre-2015 period, particularly during the Obama years. Accordingly, the Paris Agreement reinforced but did not initiate U.S. decarbonization.
However, the current situation under President Trump's second administration (2025–present) represents a significant policy reversal. In January 2025, President Trump again withdrew the United States from the Paris Agreement, marking the second U.S. exit from the accord (Trump, 2025). This withdrawal, combined with efforts to repeal key provisions of the Inflation Reduction Act and halt renewable energy authorizations on federal lands, signals a retreat from federal climate leadership (Oxford Economics, 2025). While modeling suggests that U.S. emissions may continue to decline through 2040 due to state policies, market forces, and technological momentum, the pace of reduction is expected to slow considerably in the absence of federal support.
The dominant driver of U.S. emissions decline remains energy sector transformation, rather than demographic or affluence effects. Whether this transformation continues at a pace sufficient to meet long-term climate goals—including the improved but still insufficient Biden NDC targets and aspirational 2050 net-zero commitments—will depend significantly on state-level policies, private sector investment, and whether future administrations restore federal climate ambition.
This analysis focusses exclusively on CO₂ emissions; methane and nitrous oxide remain non-trivial, although broader GHG trends generally mirror CO₂ patterns. Attributing causality to the Paris Agreement is difficult, as many U.S. policies predate it and federal climate action since 2017 has been inconsistent. External shocks, including the 2008 financial crisis, COVID-19 in 2020, and the Inflation Reduction Act (2022), further complicate attribution. Recession-exclusion analysis shows that economic downturns temporarily accelerate emissions reductions, but structural changes in the energy system drive long-term decarbonization trends.
The author of this paper contributed to the concept, research design, data analysis, writing, and editing, and takes full responsibility for its accuracy and integrity. ChatGPT (version 4.0) was used as a tool in several ways: (1) to provide a structured outline for the commentary format; (2) to generate the initial data table template and perform calculations verification; (3) to improve clarity and readability of the manuscript; and (4) to assist with literature searches and citation formatting. Consensus AI was explored for literature review purposes, though peer-reviewed sources were independently verified through Google Scholar and institutional databases. The figure was created using World Bank and Our World in Data visualized with ChatGPT assistance. All interpretations, arguments, conclusions, and any errors or omissions remain solely the author's responsibility, not that of the AI tools employed.
Aldy, J. E., Gerarden, T. D., & Sweeney, R. L. (2023). Investment versus output subsidies: Implications of alternative incentives for wind energy. Journal of the Association of Environmental and Resource Economists, 10(4), 981–1018.
Bistline, J. E. T., et al. (2022). The U.S. energy transition: Drivers, uncertainties, and policy implications. Energy Policy, 164, Article 112889.
Climate Action Tracker. (2024). USA climate target update. https://climateactiontracker.org/countries/usa/
Cooper, J., Stamford, L., & Azapagic, A. (2016). Shale gas: A review of the economic, environmental, and social sustainability. Energy Technology, 4(7), 772–792.
Council of Economic Advisers. (2016). The economic record of the Obama administration: Addressing climate change. The White House. https://obamawhitehouse.archives.gov/the-press-office/2016/09/21/cea-report-economic-record-obama-administration-addressing-climate
Feng, K., Davis, S. J., Sun, L., & Hubacek, K. (2015). Drivers of the US CO2 emissions 1997–2013. Nature Communications, 6, 7714. https://doi.org/10.1038/ncomms8714
Intergovernmental Panel on Climate Change (IPCC). (2021). Climate change 2021: The physical science basis. Contribution of Working Group I to the Sixth Assessment Report. Cambridge University Press.
Jiang, M., Griffin, W. M., Hendrickson, C., Jaramillo, P., VanBriesen, J., & Venkatesh, A. (2011). Life cycle greenhouse gas emissions of Marcellus shale gas. Environmental Research Letters, 6(3), 034014. https://doi.org/10.1088/1748-9326/6/3/034014
Our World in Data. (2024). CO2 and greenhouse gas emissions dataset. https://ourworldindata.org/co2-and-greenhouse-gas-emissions
Oxford Economics. (2025). Trump 2.0: US climate policy in retreat. https://www.oxfordeconomics.com/resource/trump-2-0-us-climate-policy-in-retreat/
Ritchie, H., Rosado, P., & Roser, M. (2024). CO2 and greenhouse gas emissions. Our World in Data. https://ourworldindata.org/co2-and-greenhouse-gas-emissions
Trump, D. J. (2025). Executive Order 14162: Withdrawal from the Paris Climate Agreement. Federal Register.
Weber, C. L., & Clavin, C. (2012). Life cycle carbon footprint of shale gas: Review of evidence and implications. Environmental Science & Technology, 46(11), 5688–5695. https://doi.org/10.1021/es300375n
World Bank. (2024). World development indicators. https://data.worldbank.org

This work is licensed under a Creative Commons
Attribution-NonCommercial-ShareAlike 4.0
International license