
Online
ISSN 2819-7046
SPECIAL ISSUE: ECONOMICS OF CLIMATE
CHANGE
2026
Cost-Benefit Analysis of
Fire-Resilient Home Retrofitting
In Canada, governments now spend over a billion dollars annually on wildfire suppression, a cost that only grows as wildfires continue to increase in frequency, intensity, and destructiveness. Investing in residential wildfire resilient retrofits is a cost-effective strategy for preventing home loss during these disasters, lowering ignition risk, and offering a high return per dollar spent. Recent years have shown how costly major wildfires can be; the 2016 Fort McMurray wildfire resulted in over CAD 3.8 billion in insured damages and an estimated loss of oil sands production revenue of over CAD 45.3 million per day (Quiroz & Thomas, 2025). Natural Resources Canada (2025) predicts that wildfires will increase in frequency and in the severity of their economic and environmental impacts with climate change. Figure 1 illustrates the increase in the number of wildfires and burned area across Canada, emphasizing the urgency of shifting toward preventive strategies.
Wildfire-resilient retrofits are physical upgrades made to existing homes to reduce the likelihood of ignition during wildfires. These upgrades strengthen vulnerable components of structures such as the roof, siding, vents, windows, and surrounding landscaping to ensure homes can better withstand the effects of wildfires. The necessary retrofits depend on the house's vulnerabilities. Barrett & Quarles (2024) highlight that wildfire-resilient retrofitting is becoming a priority for major institutions and governments across the United States, which are increasingly funding programs and analyses to support these upgrades. This demonstrates the growing recognition of home retrofitting as an effective strategy for reducing wildfire loss. Headwaters Economics (2024) conducted research on the costs of retrofitting for a typical 2,000-square-foot, two-story home, basic upgrades such as vegetation management, prevention of the accumulation of combustible debris, or enclosing under-deck areas can cost as little as CAD 3,000. Fire Smart BC (2025) found that to reach the National Guide standards, it costs approximately CAD 9,000–21,000. More substantial retrofitting falls into three general categories. “Good”–level retrofits range from CAD 32,000–56,000 and may include ember-resistant vents and modest material upgrades. “Better”–level retrofits, costing CAD 56,000–84,000, typically address a broader set of vulnerabilities at the roof, siding, and deck. The “Best”-level ranges from CAD 84,000–140,000 and involves comprehensive hardening such as Class A roofing, non-combustible cladding, fire-resistant fencing, and dual-paned tempered windows. These measures target the main causes of home ignition in wildland-urban interface fires: wind-driven embers, radiant heat, and direct flame contact (Headwaters Economics, 2024). Westhaver (2017) conducted a study on 49 of the houses affected by the 2016 Fort McMurray wildfires. The study investigated the correlation between their FireSmart hazard level and the average level of loss. The results indicated that houses with lower fire hazard risk had significantly higher survivability rates, whereas those with a higher hazard rating had a lower rate of survival. This relationship can be used to estimate potential risk reduction associated with different levels of retrofitting.
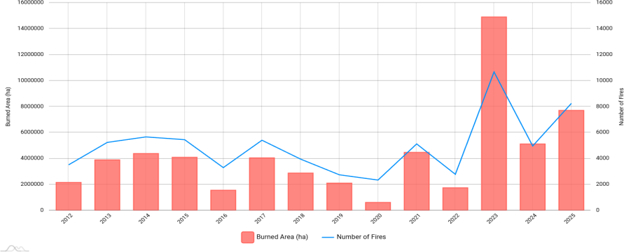
Figure 1. Wildfire Burned Area & Number of
Fires (GWIS)
Long Description
Table 1 summarizes the above information and shows that all retrofit levels substantially reduce the probability of home loss during a wildfire, but the financial return varies depending on the cost of the upgrades. Using the survivability ranges in the table and assuming a typical home valued at CAD 500,000, the “Basic FireSmart Actions” category yields the highest return per dollar invested. Increasing survivability from roughly 10% to 29–34% reduces the loss probability from 90% to 66–71%, generating an estimated avoided loss in the range of CAD 95,000–120,000. With retrofit costs ranging from CAD 3,000–21,000, this corresponds to a benefit that is nine times the cost. Assuming that a major wildfire is likely to occur at least once over the next 30 years, this avoided-loss benefit corresponds to an approximate annual return of about 7.6%, making basic upgrades the strongest economic choice.
Higher retrofit levels (“Good,” “Better,” and “Best”) further increase survivability, but because their costs rise more steeply, the implied annualized financial returns fall to approximately 5.8%, 5.1%, and 3.5%, respectively. Thus, the largest gains per dollar come from the low-cost FireSmart measures, even though premium upgrades provide greater overall protection. Additionally, these estimates exclude potential insurance savings and important non-market benefits such as reduced displacement, stress, and community disruption, meaning the true return to retrofitting is likely even higher. It is also important to recognize that the costs of wildfire-resilient retrofits are typically borne by homeowners. This may create barriers for lower-income households, which may lack the financial capacity to implement even lower-level mitigation measures, leaving them disproportionately exposed to wildfire risk. These circumstances raise important equity concerns and highlight a potential role for targeted public subsidies or incentive programs to support wider adoption.
| Retrofit Level | Typical Cost (thousands of dollars) | Estimated Survivability (%) | Expected Avoided Losses (thousands | Benefit-Cost |
|---|---|---|---|---|
| No Retrofits | 0 | 10 | - | - |
| Basic FireSmart Actions | 3-21 | 29-34 | 95-120 | 9 |
| Good | 32-56 | 34-50 | 200-280 | 5.5 |
| Better | 56-84 | 50-65 | 280-350 | 4.5 |
| Best | 84-140 | 66-73 | 310-315 | 2.8 |
Note. Expected avoided losses are estimated using a CAD 500,000 home value and survivability ranges from Westhaver (2017). The benefit-cost ratio is measured at the midpoint of avoided losses and typical costs. Costs are drawn from Headwaters Economics (2024) and FireSmart BC (2025).
Headwaters Economics (2024) and FireSmart BC (2025) provide cost ranges for wildfire-resilient retrofits but do not directly report homeowner-level return on investment. The benefit–cost ratios and annualized returns reported here are my own estimates, calculated by combining those cost ranges with survivability data from Westhaver (2017) and an assumed home value of CAD 500,000. The high return on investment comes from the reduced risk associated with retrofit levels (i.e., higher survivability). This finding is supported by research conducted by Syphard & Keeley (2019), who found that introductory low-cost retrofits such as ember-resistant vents and enclosing open spaces are crucial in reducing home loss, as they typically target primary pathways of fire penetration. As additional higher cost retrofits are implemented, such as upgraded windows, roofing, and siding, the overall resistance of the structure increases, but the higher costs result in a lower return when compared to lower-cost items. In addition, fire resilient retrofits typically last longer than traditional home materials, and retrofitting gives homeowners the opportunity to receive lower insurance costs.
Overall, wildfire resilient retrofits are one of the most cost-effective options for reducing the growing risks posed by worsening wildfires. While higher-level upgrades offer greater protection, this analysis shows that lower-cost FireSmart actions offer the strongest return on investment by drastically increasing survivability at a relatively low cost. As communities continue to face more frequent wildfires, both homeowners and governments should prioritize the adoption of these measures. Moreover, when routine home renovations are required, such as replacement of roofing, siding, and other exterior materials, choosing fire-resistant materials offers an efficient, incremental approach to strengthen home resilience without the upfront cost of a full retrofit. Together, these provide a practical and less financially intensive path to reducing loss.
I would like to thank my professor, Dr. Peter Tsigaris, for providing guidance, feedback, and support during the development of this commentary. Any remaining errors or oversights are my own. ChatGPT was utilized to provide feedback on the organization, clarity, and readability of my commentary. No content was generated without my review, and all quantitative analysis, evidence interpretation, and final arguments are my own work.
Barrett, K., & Quarles, S. L. (2024). Retrofitting homes: Cost of mitigation strategies for improved wildfire resistance. Fire and Materials. Advance online publication. https://doi.org/10.1002/fam.3261
FireSmart BC. (2024). Wildfire development permit areas. https://firesmartbc.ca/wp-content/uploads/2024/10/2024.10.02_FSBC_Wildfire_DPA_Guidance.pdf
Global Wildfire Information System. (2025). GWIS annual statistics for Canada. https://gwis.jrc.ec.europa.eu/apps/gwis.statistics/estimates
Headwaters Economics. (2024). Retrofitting a home for wildfire resistance. https://headwaterseconomics.org/wp-content/uploads/2024/06/Wildfire_Retrofit_Report_R5.pdf
Institute for Catastrophic Loss Reduction. (2021). An impact analysis for the National Guide for Wildland-Urban Interface fires. https://www.iclr.org/wp-content/uploads/2021/05/ICLR-SPA-Risk-Impact-Analysis-for-the-National-WUI-Fire-Guide-2021.pdf
Natural Resources Canada. (2025). Impacts of climate change on forests. https://natural-resources.canada.ca/climate-change/climate-change-impacts-forests/impacts-climate-change-forests
Quiroz, K. & Thomas, W.. (2025, October 3). How wildfires disrupt Canada’s economy: Trade & infrastructure impacts. Export Development Canada. https://www.edc.ca/en/article/2025-wildfires-impact-canadian-trade.html?utm
Syphard, A. D., & Keeley, J. E. (2019). Factors associated with structure loss in the 2013–2018 California wildfires. Fire, 2(3), 49. https://doi.org/10.3390/fire2030049
Westhaver, A. (2017, March). Why some homes survived: Learning from the Fort McMurray wildland/urban interface fire disaster. Institute for Catastrophic Loss Reduction. https://www.iclr.org/wp-content/uploads/PDFS/why-some-homes-survived-learning-from-the-fort-mcmurray-wildland-urban-interface-fire-disaster.pdf?utm
Figure 1: Chart showing wildfire activity in Canada between 2012 and 2025 using two measures: burned area (red bars, measured in hectares) and number of fires (blue line). Burned area varies significantly across years, with moderate levels from 2012–2018, a decline around 2019–2020, and large spikes after 2021, peaking dramatically around 2023 before declining somewhat in 2024–2025. The number of fires follows a fluctuating pattern but increases in years with severe wildfire seasons. The figure illustrates growing variability and occasional extreme wildfire years, emphasizing the increasing scale of wildfire impacts in Canada.
Back to Figure 1

This work is licensed under a Creative Commons
Attribution-NonCommercial-ShareAlike 4.0
International license